meta data for this page
Adding data to ICE-D from the Admin Page

In this tutorial we will be teaching users our best practices for adding data to ICE-D through the admin page on the ICE-D website. In the past, we had folks from the community add data directly to the database through SQL clients such as Heidi and Sequel Pro, but users will now be adding data in excel spreadsheet format (other formats also available) to a page on the ICE-D website! We are hoping this will streamline the data entry process for ICE-D.
Before beginning, be sure to contact Greg Balco (balcs@bgc.org) or Joe Tulenko (jtulenko@bgc.org) and one of us will get you set up as a standard editor on the ICE-D admin page.
Also see a page with notes on some less common data entry cases if what you are looking for is not covered here.
Step 1. Begin the tutorial by navigating to the admin page (https://version2.ice-d.org/admin/) on the ICE-D website. Use the credentials given to you either by Greg or Joe to log in. You should see a page similar to the one below:
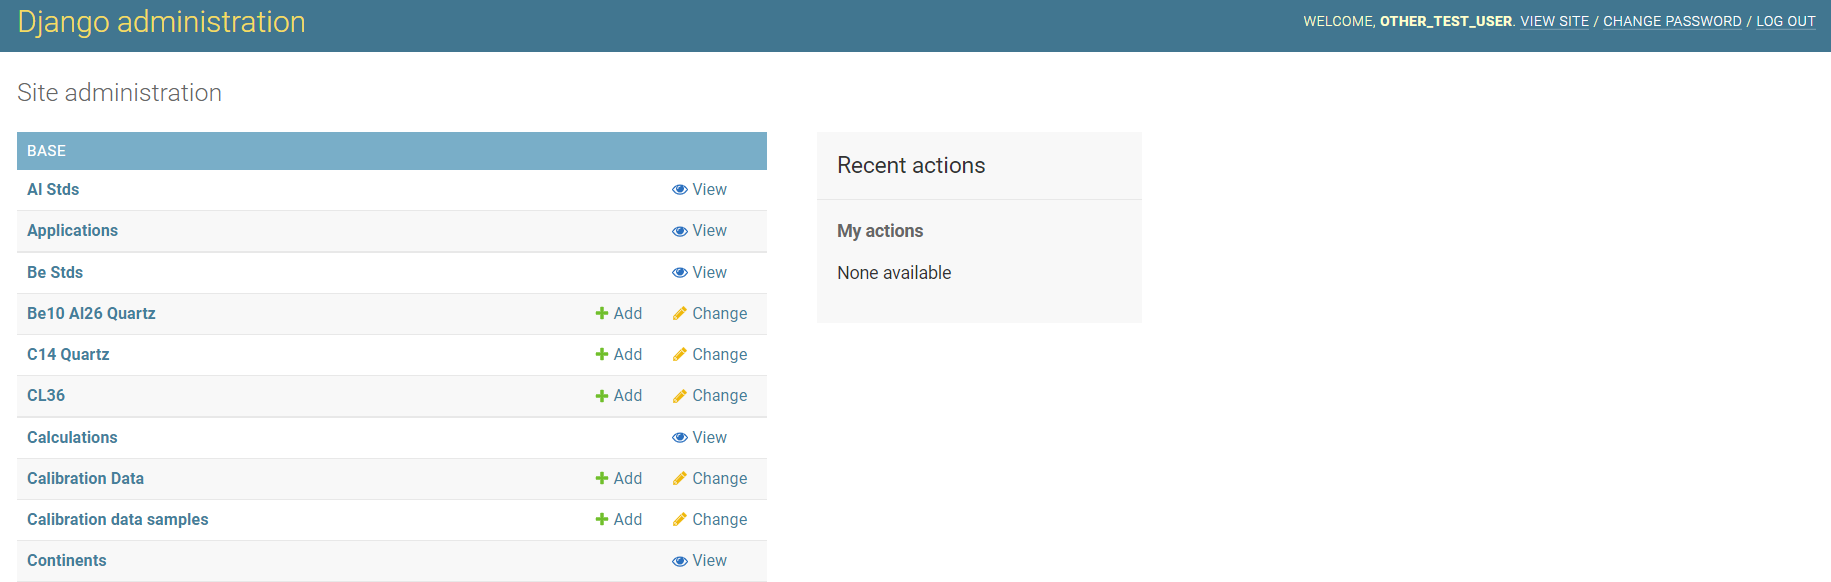
You will notice there are several links to various ICE-D tables on the left side of the screen. In this tutorial, for simplicity, we are going to focus only on the four most relevant tables for users adding new 10Be simple exposure entries (Regions, Sites, Samples and Be10 Al26 Quartz). Furthermore, these four tables have more columns/attributes beyond those necessary to calculate exposure ages but we are going to focus only on those that are necessary to calculate simple exposure ages (and make proper table relations; more on that below).
That said, we encourage admin users to be as thorough as possible when doing data entry because if you don’t add column data now, people like me will have to fill in your blanks later.
Step 2. The general workflow for adding new data to the database needs to follow a specific path because of the way that tables in ICE-D are linked (aka, related). Following industry standards that make the database run quickly and ensure that each entry has a unique identifier, we rely on the database generating unique id numbers for each new entry. For those familiar with adding data to the original database, we used to rely on entry names (e.g., sample names or site names) to link tables as opposed to unique ids. Our four most important tables for 10Be simple exposure ages:
• REGION
• SITES
• SAMPLES
• BE10 AL26 QUARTZ
are related in the following way:
| REGION → SITES | unique id generated for a REGION and referenced in SITES table |
| SITES → SAMPLES | unique id generated for a SITE and referenced in the SAMPLES table |
| SAMPLES → BE10/AL26 QUARTZ | unique id generated for a SAMPLE and referenced in BE10 AL26 QUARTZ table |
Note that unique ids are generated by the database/admin window on ICE-D and users will not be required to generate the ids on their own. However, users will need to reference unique ids generated by ICE-D to make the correct table relations (as outlined in the table above).
Because certain tables need a referenced id from another table to exist before an entry can be created and properly related, it makes the most sense to create tables in a specific ordered fashion: Region first, Sites second, Samples third and Be10 Al26 Quartz last.
Briefly, we set up these table relations to avoid certain impossibilities. For example, we link the Region table and Sites table through a unique Region id so that multiple sites can fall under the same Region (i.e., multiple entries in the Sites table can use the same Region id) BUT the set up makes it impossible for a single site to be referenced in multiple Regions (i.e., a single moraine can’t exist in two geographic locations at once).
We currently have other tables set up that allow for two-way relations, such as sample-publication matching (i.e., a sample can be referenced in more than one publication, and of course a single publication can reference more than one sample). In this case, a user would have created sample entries all with their own unique ids, a user would create one/more publications in the publications table each with their own set of unique ids, and then there is a third table, the Sample Publication Matches table where each relation is a new entry.
For example, a publication with 10 samples requires 10 entries in the Sample Publication Matches table, one for each sample. Additionally, if a later publication references let’s say 5 of those samples in the original publication, there needs to be 5 new entries in the Sample Publication Matches table to link those 5 samples to the new publication.
Step 3. Beginning with the Region table, users can view all of the entries in the Region table by selecting Region from the list of tables on the admin home page. In the Region table page, there should be an ”add Region” button near the top of the page. Select it and it should take you to a new window.
Fill out the entry window with whatever geographic name you wish to call your Region of interest. Please note that by the date of this tutorial there are 718 Regions; it is entirely possible that your Region of interest already exists! Check the ICE-D webpage to make sure that you need to generate a new Region. (In the event that the new samples you wish to add fall under a Region that already exists, be sure to find the unique id for that Region since you will need it for the Sites table.)
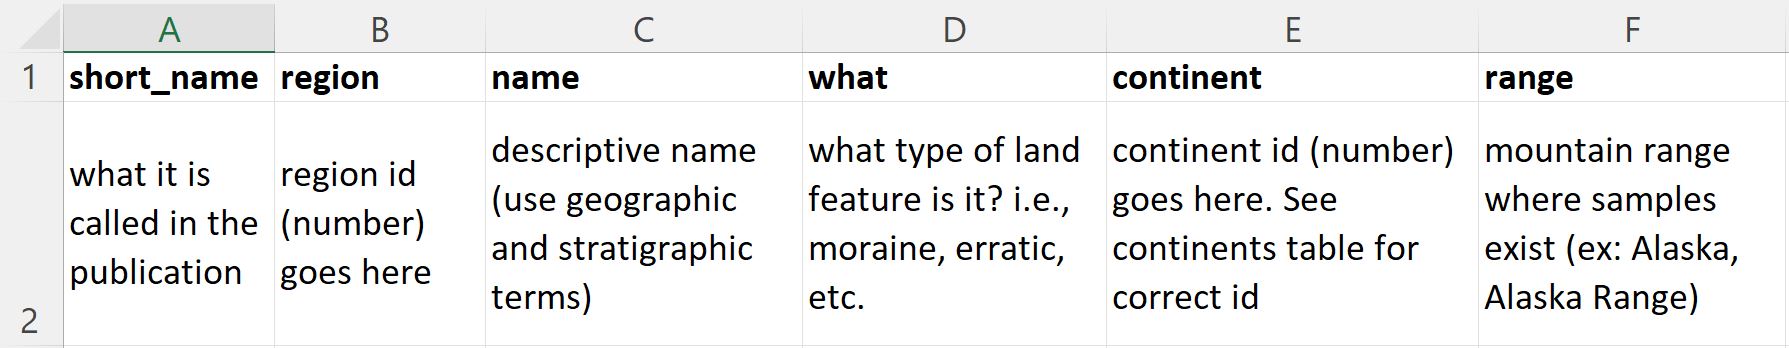
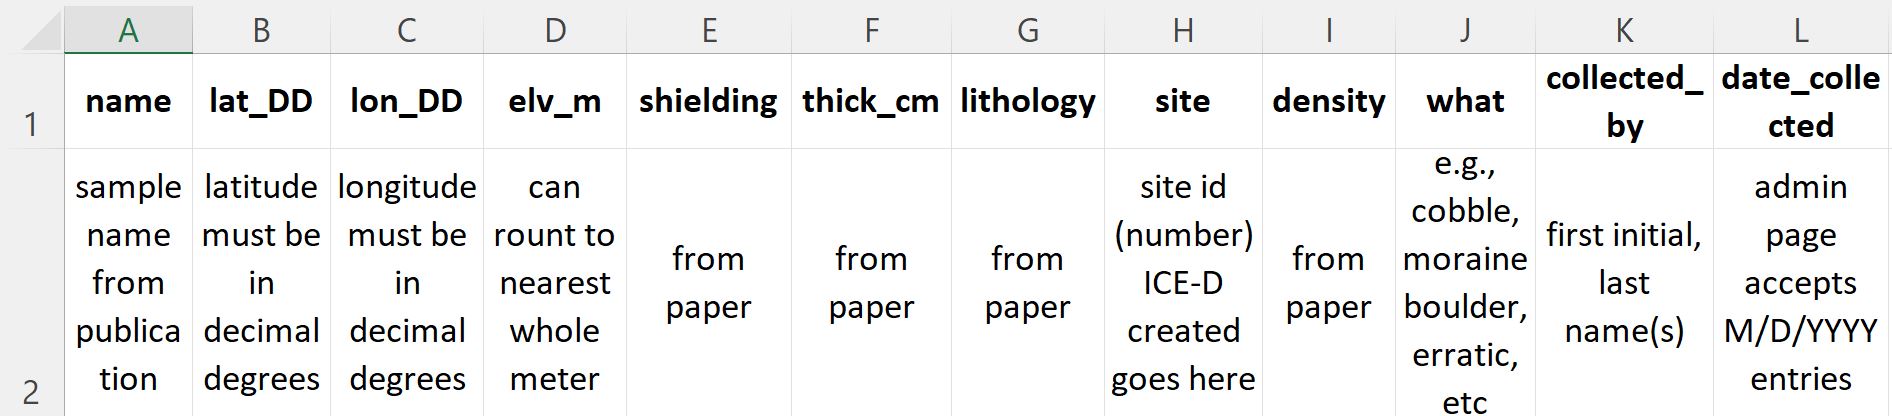
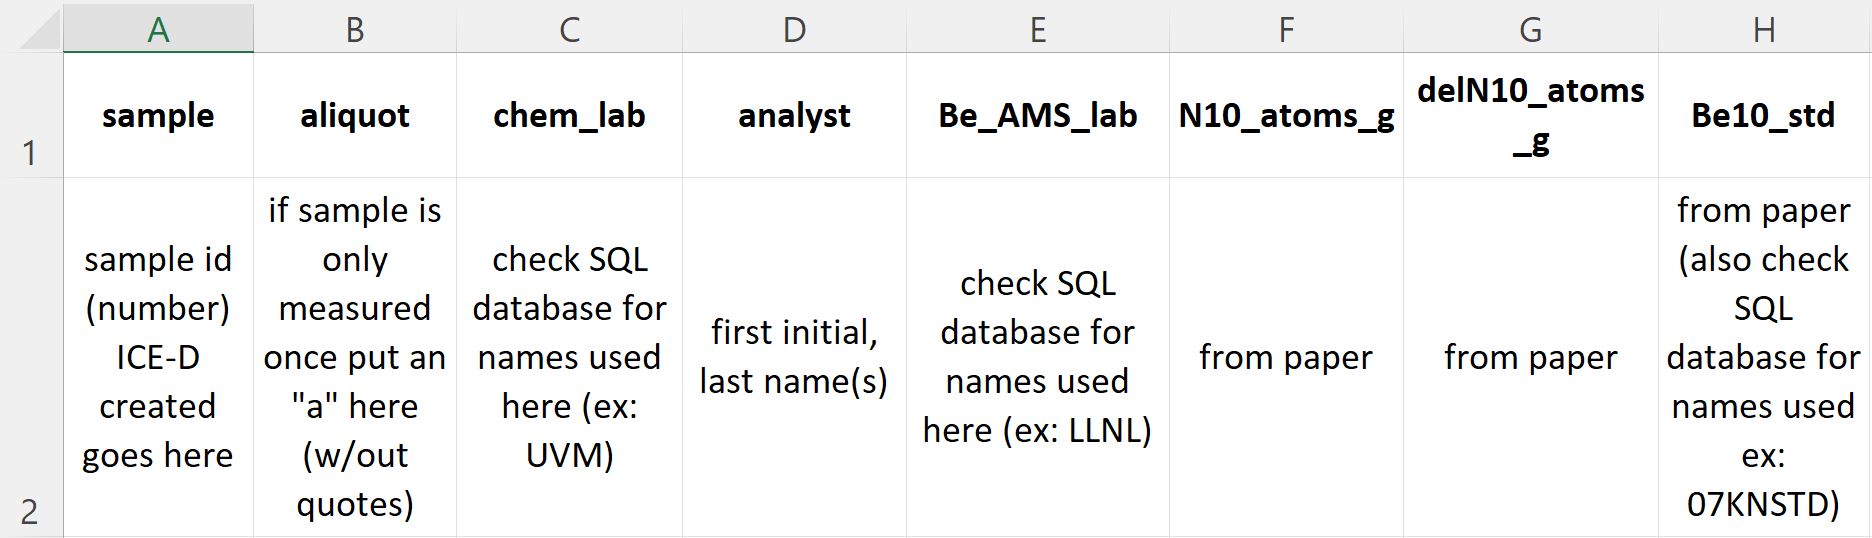
For the remaining tables except Sites and Publications - Samples, Be10 Al26 Quartz, Sample Publication matches - the admin page allows users to directly upload excel spreadsheets. For each table, we are including a screenshot of the basic columns needed to set up proper table relations and allow for calculating simple exposure ages using the version 3 Cronus Earth calculator.
IMPORTANT: If you miss any of these entries your samples will not show up properly and you may cause an error on the ICE-D web page (don’t worry you won’t kill ICE-D, you just need to amend your entries for the error to go away.)
SITES
SAMPLES
Be10 Al26 QUARTZ
Step 4. Once you have these three excel tables set up, one by one import (or manually enter) them into their respective ICE-D tables in the admin page. We will show what it looks like to import entries for the Samples table, but the process is essentially the same for other tables that work for importing.
NOTE: STANDARD EDITORS CANNOT BULK IMPORT SITES DUE TO RESTRCITIONS ON WHICH APPLICATIONS THEY HAVE ACCESS TO. SITE ENTRIES MUST BE MADE ONE AT A TIME! We recommend creating an excel page for sites (similar to the other tables like samples, be10al26 Quartz, etc.) to keep track of each site and their attributes/fields to help with manual data entry.
ANOTHER NOTE: Please be sure when manually entering sites that you specify which application(s) the sites belong to. This is a required step and if it is skipped, your data will not show up on the ICE-D webpage.
Navigate to the Samples table in the admin page. You will see a list of sample entries arranged latest to first. There should be an import button near the top of the page, select that button.
The page displayed should look similar to the screenshot below:
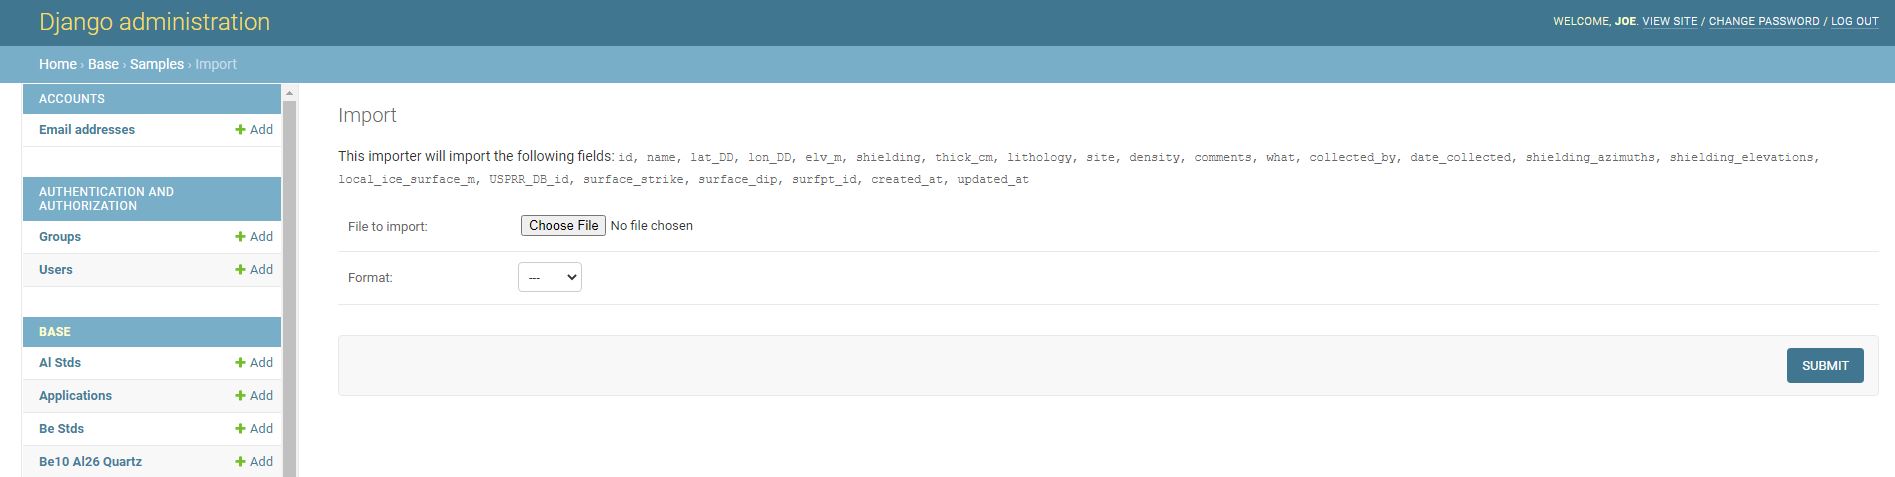
Note here that all of the columns with their respective titles show up on this page in the order they need to be entered. If there is additional info you want to add besides the info we outline in this tutorial, refer to the import page for column names and order.
Choose the file you wish to import (be sure that it is saved as a .xlsx file), and from the format drop down menu select .xlsx (this works for other file formats such as csv, but xlsx is the simplest to work with so we suggest sticking with that file format).
Once you have done this, you can hit the submit button, which takes you to a preview page before the submission is complete. If you run into an error on the preview page, try to read what the error is and amend your excel sheet, then re-upload. If something is still wrong, email Greg or Joe.
On the preview page, if you uploaded successfully, there should be green highlighted rows with all of the entry info you uploaded. Double check each entry to make sure all of the information is correctly entered. Once you are satisfied with the preview page, hit confirm import. This should send you back to the Samples table and you should see your individual samples added to the table! Nice.
Go through and add the remaining tables (e.g., Be10 Al26 Quartz, Publications, sample publication matches, etc.) to the database.
Step 5 When you are done uploading/manually entering data, check the ICE-D webpage to make sure all of your data entry is correct! The webpage calculates exposure ages using the version 3 calculator, the default production rate and two scaling schemes (St and LSDn). If those calculations do not show up you may have missed a necessary column or made an error in your data entry. If it is an easy fix you can edit any Sites, Samples, or Be10 Al26 Quartz entry directly in the admin by selecting the entry and editing information displayed on the page. If it the error looks really messy, no worries just email Greg or Joe and we can help sort it out.
Hint: ICE-D also prints out sample information in the version 3 exposure age calculator format. Check here first to see if there are any obvious errors.
As always, please don’t hesitate to contact Greg Balco (balcs@bgc.org) or Joe Tulenko (jtulenko@bgc.org) if something gets horribly messed up or if there is any confusion, you have questions, etc. We are always welcoming suggestions from the commmunity as well so please email us if you have suggestions that may improve ICE-D.
Thanks for following along!